
Technical Analysis : Why You Lose Money With It
Technical analysis is a method used by traders and investors to make decisions about buying and selling financial assets, such as stocks, commodities, or currencies, based on the analysis of historical price charts and trading volumes. There are four basic principles or concepts in technical analysis:
Price Discounts Everything: This fundamental concept of technical analysis assumes that all information, whether it be public or private, is already reflected in the price of an asset. In other words, past price movements and trading volumes provide insights into the collective sentiment and expectations of market participants.
Price Moves in Trends: Technical analysts believe that prices tend to move in trends over time. A trend is a sustained direction in which an asset’s price moves, and it can be upward (bullish), downward (bearish), or sideways (consolidation). Identifying and following trends is a central part of technical analysis.
History Tends to Repeat Itself: Technical analysis relies on the idea that historical price patterns and trends tend to repeat themselves due to the behavior of market participants, driven by human psychology and emotions. Analysts use historical data to identify potential future price movements.
Volume Confirms Price: Volume refers to the number of shares or contracts traded in a specific asset over a given period. Technical analysts believe that changes in trading volume can confirm or contradict price movements. For example, a price increase accompanied by high trading volume may indicate strong buying interest and validate an upward trend.
These four basics of technical analysis serve as the foundation for various technical indicators and chart patterns that analysts use to make trading decisions. It’s important to note that technical analysis is just one approach to analyzing financial markets, and it has its limitations. Critics argue that it may not account for fundamental factors, economic events, or news events that can also influence asset prices. Therefore, many traders and investors combine technical analysis with fundamental analysis to make more informed decisions.
What Are The 4 Basics Of Technical Analysis?
Introduction To Technical Analysis : Technical analysis is a method used by traders and investors to analyze financial markets and make informed decisions about buying or selling assets. It involves studying historical price data, volume, and other market indicators to predict future price movements. One of the key aspects of technical analysis is the identification of trends, as it assumes that historical patterns tend to repeat themselves.
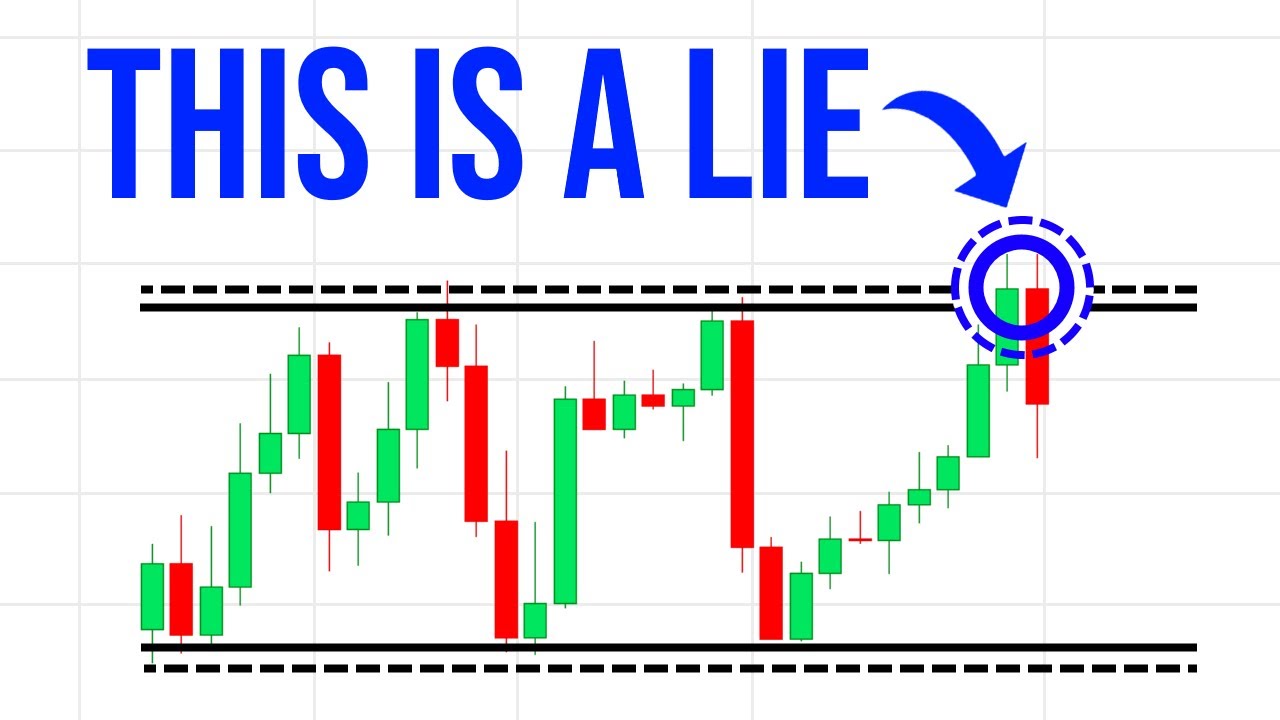
By understanding these patterns, traders can anticipate potential price changes and take advantage of market opportunities. There are four fundamental principles that form the basis of technical analysis. Firstly, the concept of support and resistance levels helps identify levels at which prices tend to stop falling or rising further. Secondly, trend lines assist in determining the direction in which an asset’s price is moving over time.
Thirdly, chart patterns provide insights into potential reversals or continuations in price trends. Lastly, technical indicators such as moving averages or oscillators help interpret market conditions by analyzing price data.
Understanding The Four Basics Of Technical Analysis
Technical analysis is a method used by traders and investors to predict future price movements of financial assets. By analyzing historical market data, technical analysts seek to identify patterns and trends that can provide insights into future price behavior. There are four key principles that form the foundation of technical analysis. The first principle is that prices already reflect all available information.
This means that all relevant factors, such as economic conditions, investor sentiment, and company performance, are already incorporated into the asset’s price. The second principle is that prices move in trends. Technical analysts believe that once a trend is established, it is likely to continue until there is evidence of a reversal. The third principle states that history tends to repeat itself.
Patterns observed in past price movements often repeat in the future, allowing traders to make informed decisions based on these recurring patterns. Lastly, technical analysts use indicators and chart patterns to identify potential buying or selling opportunities.
Key Components Of Technical Analysis
Technical analysis is a method used by traders and investors to forecast future price movements of financial assets based on historical data. It relies on several key components to analyze market trends and make informed trading decisions. The first component is price action analysis, which involves studying patterns, trends, and support/resistance levels in the asset’s price movements. By identifying recurring patterns or trend reversals, traders can anticipate potential buying or selling opportunities.
The second component is volume analysis, which examines the trading volume accompanying price movements. High trading volume often indicates strong market participation and validates the significance of a price movement. The third component is trend analysis, which focuses on identifying the direction and strength of the prevailing market trend. Traders use various technical indicators to determine if an asset’s price is trending upward (bullish) or downward (bearish).
Lastly, technical analysts utilize momentum indicators to measure the speed at which an asset’s price changes.
Applying The Four Basics To Analyze Market Trends
When it comes to technical analysis, understanding and applying the four basics is crucial for analyzing market trends effectively. The first basic principle is trend analysis, which involves identifying the direction of a market trend – whether it’s bullish, bearish, or sideways. By recognizing the prevailing trend, traders can make informed decisions regarding their positions. The second basic principle is support and resistance levels.
These are price levels at which an asset tends to find a temporary barrier in its movement. Support refers to a level where buying pressure outweighs selling pressure, preventing further decline in price. Conversely, resistance represents a level where selling pressure exceeds buying pressure, preventing further upward movement. The third basic principle focuses on chart patterns such as triangles, head and shoulders formations, or double tops/bottoms.
Recognizing these patterns helps traders anticipate potential price movements based on historical behavior.
** TRADING BOOK **
Price Action Trading Secrets: https://priceactiontradingsecrets.com/


